appearance
Smart Clothing and Fitness Devices
Summary
Smart clothing seems to be just around the corner, with several companies already selling specialty items (athletic wear, baby clothes, etc) embedded with sensors. However, quantitative forecasts describing the prevalence of smart clothing in the next 10 years or so are hard to find. Gartner made a forecast to 2016 back in 2014. Tractica has a forecast to 2020. Both forecasts describe millions of units shipped worldwide. Although it’s difficult to extrapolate market penetration, both reports suggest that smart clothing will be more prevalent than wearable devices. Other research firms and analysts are skeptical of such a swift uptake by smart garments, instead forecasting dominance by other wearable devices.
Research Excerpts
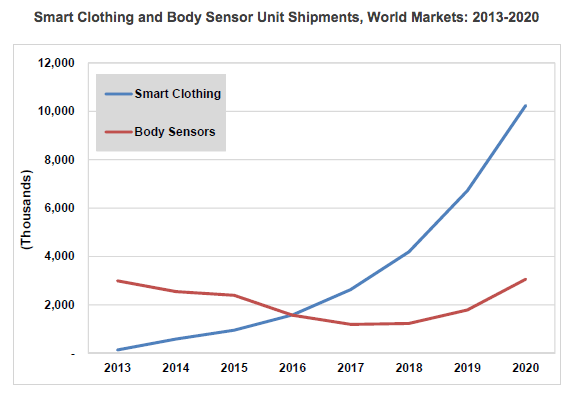
Tractica forecasts that smart clothing shipments will grow from 140,000 units in 2013 to 10.2 million units by 2020, while body sensor shipments will decrease from 3.0 million units in 2013 to 1.2 million by 2017, before rising again to 3.1 million units in 2020.
Src:
Tractica. May 4, 2015. “The Wearable Devices Market is Poised for Expansion into Smart Clothing and Body Sensors.”
Executive Summary
Chart from above report:

[via Global Information]
*
| Worldwide Wearable Electronic Fitness Devices Shipments (millions of units) | ||||
| Device Category | 2013 | 2014 | 2015 | 2016 |
| Smart Wristband | 30 | 20 | 17 | 19 |
| Sports Watch | 14 | 18 | 21 | 24 |
| Other Fitness Monitor | 18 | 20 | 12 | 15 |
| Chest Strap | 11 | 12.1 | 8 | 7.3 |
| Smart Garment | 0.01 | 0.1 | 10.1 | 26 |
| Total Market | 73.01 | 70.2 | 68.1 | 91.3 |
Src:
Gartner. November 18, 2014. “Gartner Says in 2015, 50 Percent of People Considering Buying a Smart Wristband Will Choose a Smartwatch Instead.”
Note: Angela McIntyre, Gartner research director – gave an interview to The Guardian. Might be available for comment.
*
Growth will be “largely driven by the sales of wrist-based trackers, while hundreds of thousands of connected garments used by professional sports teams showcase wearable technology’s most advanced capabilities.” Hundreds of thousands of thousands of connected garments is hardly a drop in the ocean compared to the millions of Fitbits, Xiaomis, Apple Watches, Jawbones and other devices which will be coining in the revenue by 2020. [emphasis mine]
Src:
James Stables. November 18, 2015. “Juniper Report Skeptical on Smart Clothing but Says Fitness Trackers are Set to Soar.” Wearable.com.
*
In our latest smart glasses report, we expect over 3 million smart glasses to be in use in enterprise by 2018, with nearly 6 million users. [worldwide, I think]
Src:
Juniper Research. 2015. “The World In 2020 – A Technology Vision.”
Note: The White paper seems to be referring to this paid research report.
*
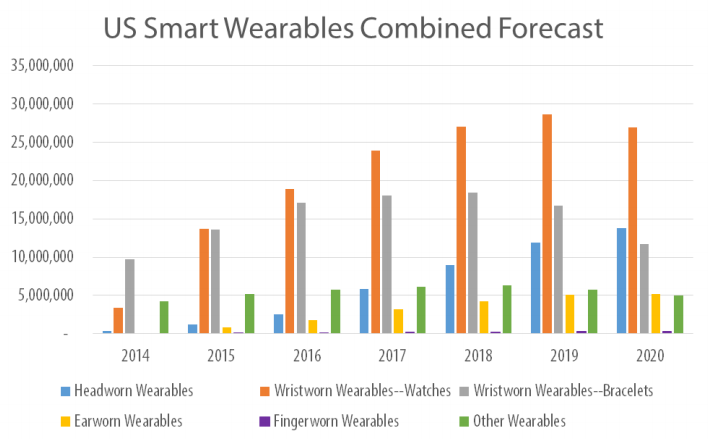
The US market for wearables is forecast to evolve more quickly than worldwide, leading to a peak of 68.3 million units in 2019, then dropping to 62.9 million in 2020.
Smart watches will be the top category as of this year in the US, followed by smart bands/bracelets.
In 2020, headworn wearables are expected to become the number two segment.
Src:
Bob O’Donnell. May 2015. “The Slow Build: Smart Wearables Forecast, 2014-2020.” Technalysis Research.
Note: This report does not include clothing with embedded sensors. Bob O’Donnell is skeptical of the ability of smart clothing to surpass other wearables in the foreseeable future.
Clothing Expenditures and Prices
Overview
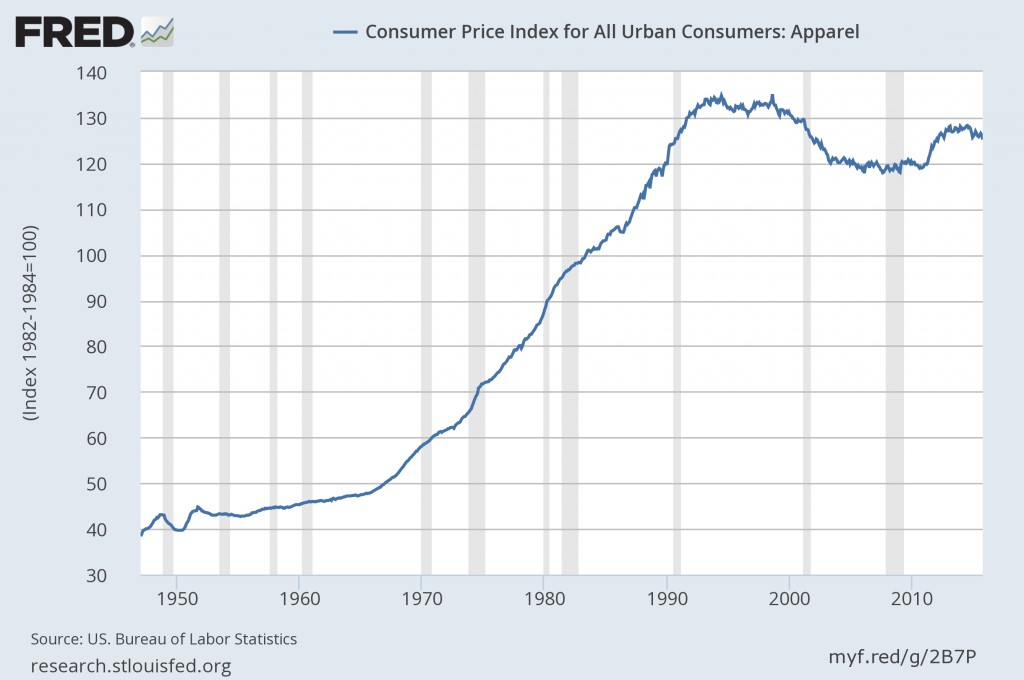
The Bureau of Labor Statistics tracks apparel expenditures as well as indexed prices (CPI – prices relative to a base year, not actual prices). Apparel includes a broad range of subcategories. Where available, we have also sought item-level data, using men’s Tshirts as an exemplar. Expenditure data is available going back to 1990. CPI data is available going back to 1947. Tshirt CPI data is available back to 1997 (possibly earlier – awaiting clarification from BLS). No forecasts found.
Findings
Clothing Expenditures – 1990-2014
Google Spreadsheet
The apparel and services category had one of the largest increases in 2014.
Average expenditures per consumer unit in 2014 were $53,495, a 4.7percent increase from 2013 levels, the U.S. Bureau of Labor Statistics reported today. During the same period, the Consumer Price Index (CPIU) rose 1.6 percent(1). In 2013, spending decreased 0.7 percent. Average pretax income per consumer unit increased at about the same pace as expenditures, up 4.8 percent from 2013.
Consumer units include families, single persons living alone or sharing a household with others but who are financially independent, or two or more persons living together who share expenses.
Srcs:
[embedded in chart above]
Note: The “Apparel and Services” category includes apparel and footwear for adults, children, and babies (including sportswear, and uniforms), as well as material for making clothes, shoe repair, alterations, sewing patterns and notions, clothing rental, storage, dry cleaning and sent-out laundry, watches, jewelry, and repairs to watches and jewelry.
Src:
Consumer Expenditure Survey Glossary, Bureau of Labor Statistics
*
Consumer Price Index, Apparel – 1947-2014

(click for larger)
Src:
US. Bureau of Labor Statistics, “Consumer Price Index for All Urban Consumers: Apparel [CPIAPPSL].” Retrieved from FRED, Federal Reserve Bank of St. Louis, November 18, 2015.
Note: Data available for download.
*
Shirt CPI 1998-2014
Men’s shirts and sweaters (SEAA03)
Series ID: CUUR0000SEAA03
base period: 1997
Annual average:
1998 100
1999 98.6
2000 98.3
2001 93.9
2002 88.8
2003 85.2
2004 85.3
2005 84.2
2006 84.7
2007 82.53
2008 80.444
2009 80.968
2010 78.642
2011 79.583
2012 82.224
2013 82.876
2014 80.973
Src:
“Consumer Price Index – All Urban Consumers.” Custom table, November 19, 2015. Bureau of Labor Statistics.
Nicole Rope, of the BLS CPI Apparel division, warns that there is much more volatility in individual clothing items that in the category on the whole (and more so compared with other items in other categories). She offers to speak with us if we have any other questions about apparel. 202-691-5395.
She also said that the Information and Analysis Section might also be helpful. Ken Stewart, manager, x6966. Steve Reed, senior economist x5378. They would be able to let us know if data older than 1997 is available. Shirt data was collected before that, but under a different name/definition.
UPDATE: Steve Reed shared the following data by email. He said that price data (not index data) older than 1977 may be available on an inconsistent basis. He will followup with whatever he can find later in December or January.
Annual Average CPI for Men’s Shirts 1978-1997
Series Id: MUUR0000SE3604
Not Seasonally Adjusted
Area: U.S. City Average
Item: Men’s shirts
Base Period: 198284=100
1978 81
1979 84.3
1980 91.4
1981 95.4
1982 98.4
1983 99.3
1984 102.4
1985 106.3
1986 107.1
1987 113.7
1988 119.9
1989 123.2
1990 128.1
1991 132.3
1992 135.3
1993 134.1
1994 131.5
1995 133
1996 135.3
1997 138.1
*
T-Shirt Prices – Misc dates 1938-2013
Based on old Sears catalogs featuring men’s white undershits
1938 .24 ($3.97 in 2013)
1945 .79 ($10.22 in 2013)
1955 .79 ($6.87 in 2013)
1970 1.492 (8.9512.01 in 2013)
1990 3.10 (Hanes)
2010 1.90 (Hanes)
2013 2.33 (Hanes)
Src:
Samantha Sharf. July 2, 2013. “The TShirt Turns 100.” Forbes.
Prevalence of Tattoos
Statistics on tattoo prevalence are quite thin, and I have not found a source for systematic, historic data. I’ve found no forecasts.
1936 – 10 million Americans, 6% of population had at least one tattoo*
(Life Magazine)
2000 – 15%, ~40 million Americans**
(National Geographic News, April 2000)
2002 – 13% (1/8) of Americans
(Esquire Magazine, March 2002)
2004 – 24% of Americans
(Laumann and Derick, 2006)
2003 – 16%
2008 – 14%
2012 – 21%
(Harris Polls)
2010 – 23%
(Pew Research, Febrary 2010)
*Haven’t been able to find this figure in the 1936 Life Magazine, but they did publish an estimate of 1/10th of Americans being tattooed. Source below. Via The Vanishing Tattoo
**Unable to find this figure, although I searched the April 2000 issue of National Geographic Magazine. Via The Vanishing Tattoo
Original sources
Life, December 21, 1936. “One Out of Ten Americans is Tattooed.” P.30.
Anne Laumann, Amy Derick. 2006. “Tattoos and body piercings in the United States: A national data set.” Journal of American Academy of Dermatology, 55(3).
Pew Research Center. February 2010. “Millennials: A Portrait of Generation next.”
The Harris Poll. February 23, 2012. “One in Five U.S. Adults Now Has a Tattoo.”
Plastic Surgery
There are at least two professional organizations that publish plastic surgery statistics: American Society of Plastic Surgeons (ASPS), and The American Society for Aesthetic Plastic Surgery (ASAPS). Figures from the latter tend to be a bit lower than the former. Seeking clarification on the discrepancy. Procedures are typically broken down into two major categories: cosmetic and reconstructive. All readily available figures from ASPS are below (2005-2014). Awaiting to hear if pre-2005 figures are also available from ASPS.
Google Sheet (with links to individual reports)
Src:
American Society of Plastic Surgeons, 2006-2015
Alternate lead:
The American Society for Aesthetic Plastic Surgery, 1997-2014 Statistics


