demographics
Population and Fertility Projections
Future population growth is highly dependent on the path that future fertility will take and according to the World Population Prospects, 2015 Revision (United Nations), global fertility is projected to fall from 2.5 children per woman in 2010-2015 to 2.4 in 2025-2030 and 2.0 in 2095-2100.
Even assuming that fertility levels will continue to decline, the global population is still expected to reach 8.5 billion in 2030, 9.7 billion in 2050 and 11.2 billion in 2100, according to the medium projection variant. In 2016, it is projected that 83 million people will be added to the world’s population.
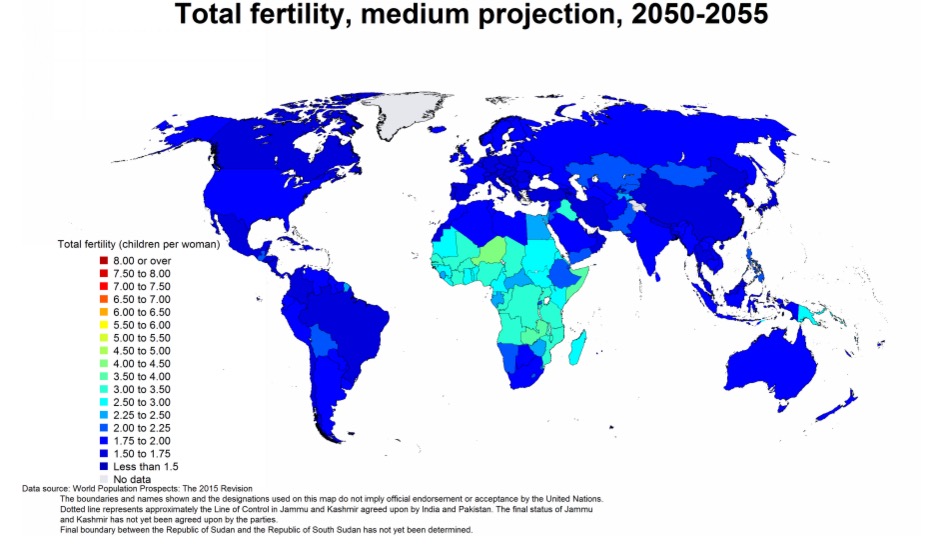
In the United States, fertility is projected to rise from 1.89 children per woman in 2010-2015 to 1.92 in 2045-2050. Below is a world map of Total fertility, 2050-2055.
Other key findings:
Data Source:
United Nations. 2015.
World Population Prospects: The 2015 Revision.
Department of Economic and Social Affairs, Population Division.
*
Src:
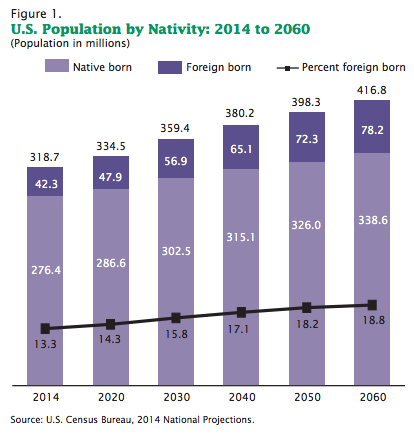
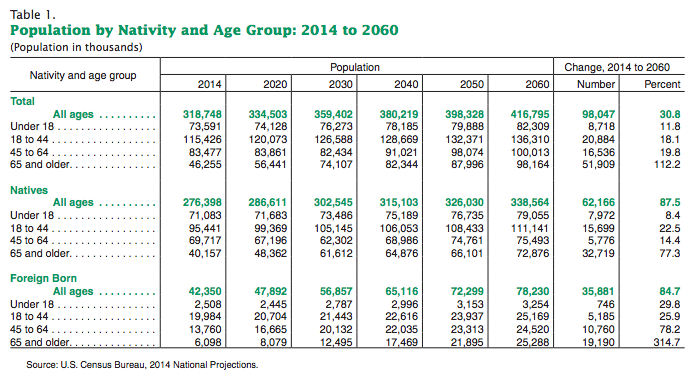
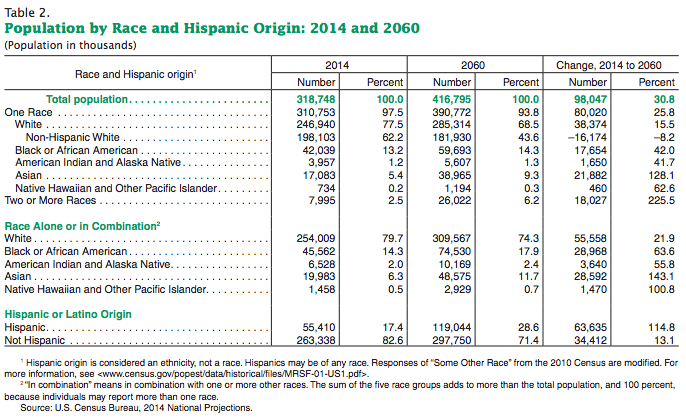
U.S. Census Bureau. March 2015.
“Projections of the Size and Composition of the U.S. Population: 2014 to 2060.”
Life expectancy at birth in 2050
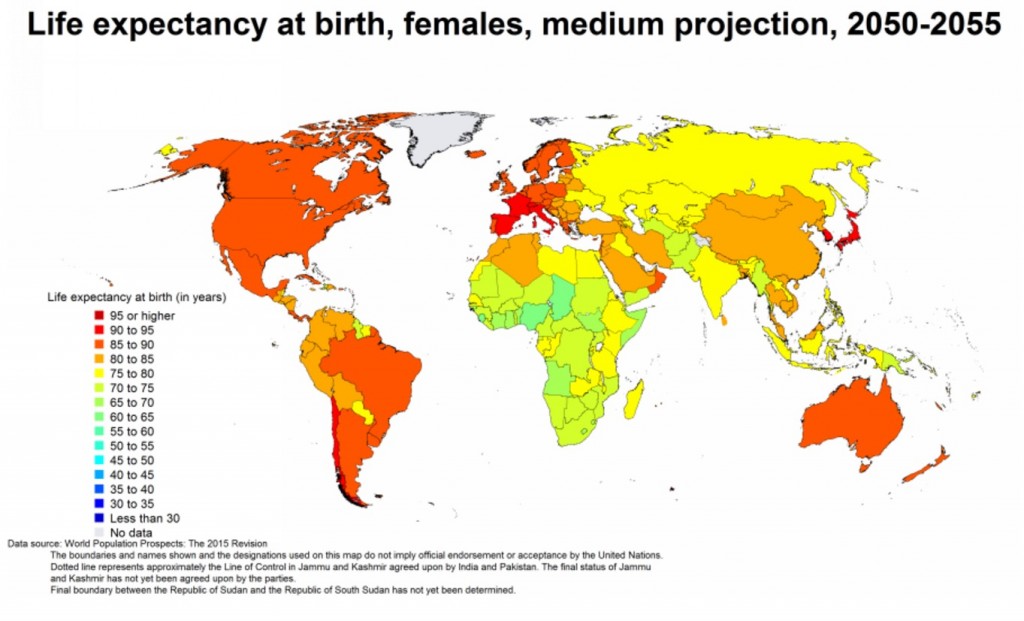
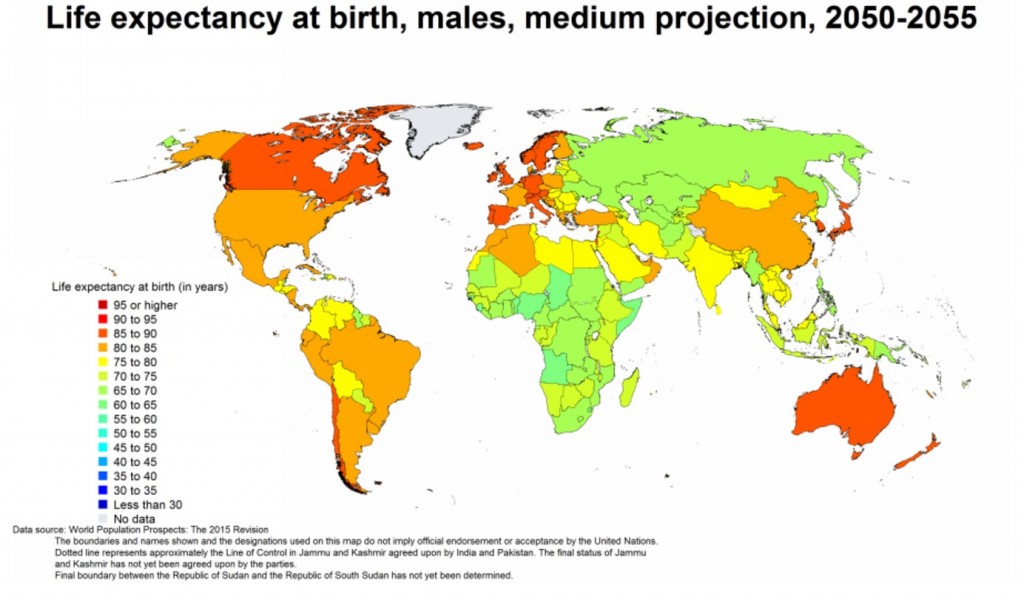
The Department of Economic and Social Affairs of the United Nations provides population projections for the period 2015-2100. Projections are presented for five-year periods. Below are world maps of life expectancy at birth for females and males, 2050-2055.
In the United States, life expectancy at birth for females is projected to rise 10 years from 80-85 years in 2015 to 90-95 years in 2050. For men, it will rise 10 years from 75-80 years to 80-85 years.
Data Source:
United Nations. 2015.
“World Population Prospects: The 2015 Revision.”
State of the Future Index (28 variables)
Every year, The Millennium Project (MP) computes a “State of the Future Index” looking 10 years into the future, based on data from the previous 20 or more years. The index calculation is based on values for multiple, individually-forecast key variables (28 in 2015). The index is calculated globally, as well as for individual countries. The overall index is intended to show the direction of things to come.
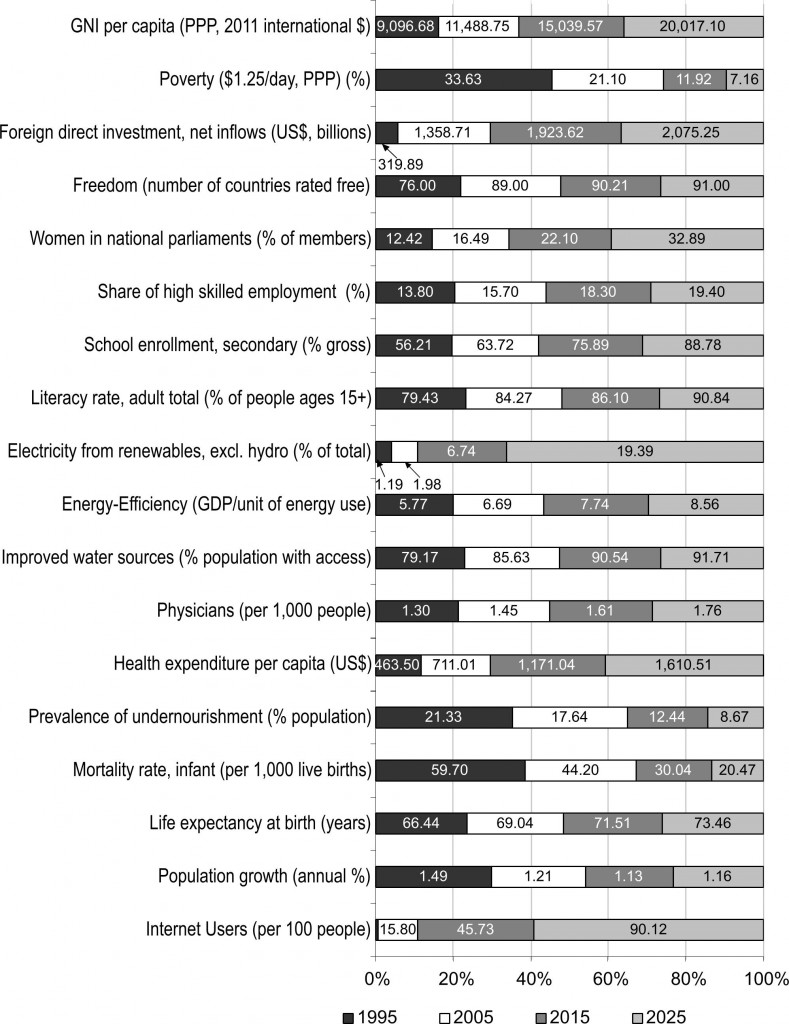
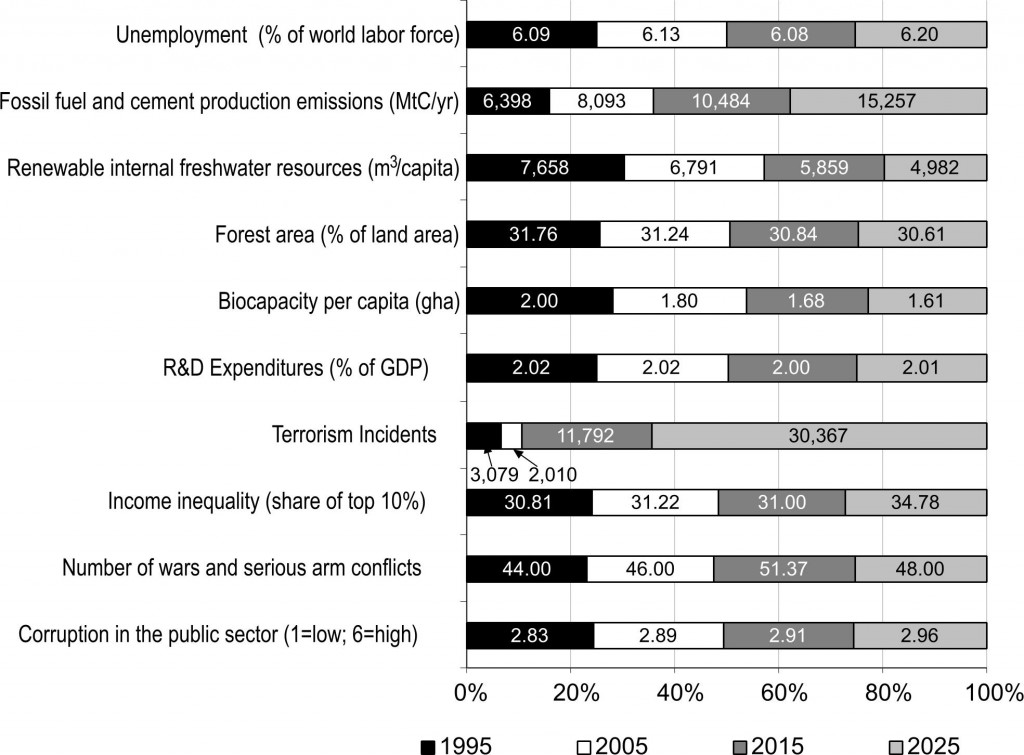
For our purposes the forecasts for the 28 individual variables are of most interest. MP breaks the variables into two groups: those showing improvement, and those showing decline. The values for the individual variables (previous actual, and forecast) are displayed within the shaded area of the charts.
Areas showing improvement in 2015:
Areas showing decline in 2015:
In 2015, the calculated Index looks like this:
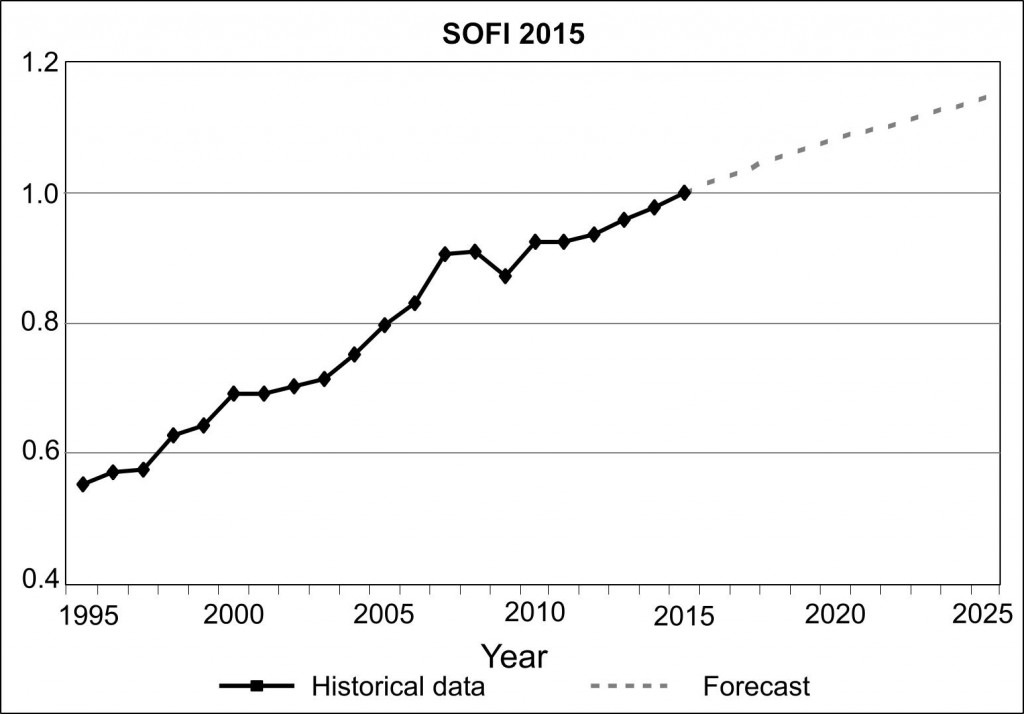
Src: Gordon, Theodore J. 2015. “2015 State of the Future Index.” The Millennium Project.
Charts for each indicator, and a brief indication of the source for the data are in this PDF.
The Millennium Project is an independent non-profit global participatory futures research think tank of futurists, scholars, business planners, and policy makers who work for international organizations, governments, corporations, NGOs, and universities. Their annual report collects and assesses judgments from over 3,000 people selected by its 56 nodes around the world.


