shopping
Global Mall Development Trends
Ask
Update on mall building rates? US? Globally? Developing world?
Trends in mall development
Results
Global Mall Construction Rates
In 2016, global shopping center completions were up 11.4% over 2015 levels, despite having slowed over the past few years.
However, the pace of development continues to slow, with the number of shopping centers under construction down 22%
The majority of added shopping center space came to market in Asia, but The Americas registered the strongest growth, with completion levels up 43.6%, fueled by construction growth in Mexico.
Src:
CBRE via Malls.com, May 2017
*
In 2016:
17% of retailers planned to open more than 40 stores
67% planned to open no more than 20
Most popular formats for expansion
76% street shops
72% regional shopping malls
45% open air shopping malls
20% transport hubs (airport, railway terminals)
18% outlets
18% retail park
15% concession counters in department stores
8% duty free
src:
CBRE Research, April 2016
“How Active Are Retailers Globally?”
*
Global shopping centre completions started to slow (in 2015) as parts of the global retail market witness the effects of an imbalance between significant supply and demand.
Despite this, there continues to be exceptional levels of construction, particularly in Asia. Globally, 10.7 million sq m of new space opened in 2015 in the 168 cities we surveyed; this is down on 2014, where 12.1 million sq m of space were completed; and a further 41.9 million sq m is under construction, up from 39 million in 2014.
src:
CBRE, April 2016
Global Retail ViewPoint – Shopping Centre Development April 2016
[full report here]
Discussion of the above CBRE report is available here.
*
Global Retail Development Index
Shows where retail investment has been most attractive (ranks top 30 countries). These are the top 10 countries in 2017
India 71.7
growing middle class, rapidly increasing consumer spending, overtakes China
China 70.4
market is maturing, still leading in e-commerce
Malaysia 60.9
good long-term prospects bc of tourists, higher disposable income, govt investments
Turkey 59.8
moved up two places
United Arab Emirates 59.4
most attractive market in the region
Vietnam 56.1
moves ahead, important market for retail expansion with its liberalized investment laws
Morocco 56.1
continues to rise in rankings, govt efforts to attract foreign investment
Indonesia 55.9
continued liberalization and infrastructure investments
Peru 54
outperforms other regional economies, two decades of solid growth
Colombia 53.6
despite lower than expected GDP growth, still attractive for retailers
src:
ATKearney, 2017
The 2017 Global Retail Development Index™
CC’s note: These rankings are available back to 2004. Could aggregate, if this were of interest to KK. (Started to aggregate a couple years’ of data, but stopped bc I wasn’t sure if it was of interest.)
Relig-Shop-Dev-Homes-Extrapolations.xlsx
GRDI tab
European Mall Construction Rates
In 2016, European shopping center construction was down 6% overall compared with 2015. Western Europe saw an increase of 15% in new shopping center completions, but this was outweighed by a 17% decline in the UK, as well as a 17% decline in Central and Eastern Europe (which also dropped 11% in 2015). Further declines are expected in 2017.
src:
Cushman & Wakefield, May 2017
“European Shopping Centers: The Development Story”
[full report behind paywall]
US Mall Construction Rates
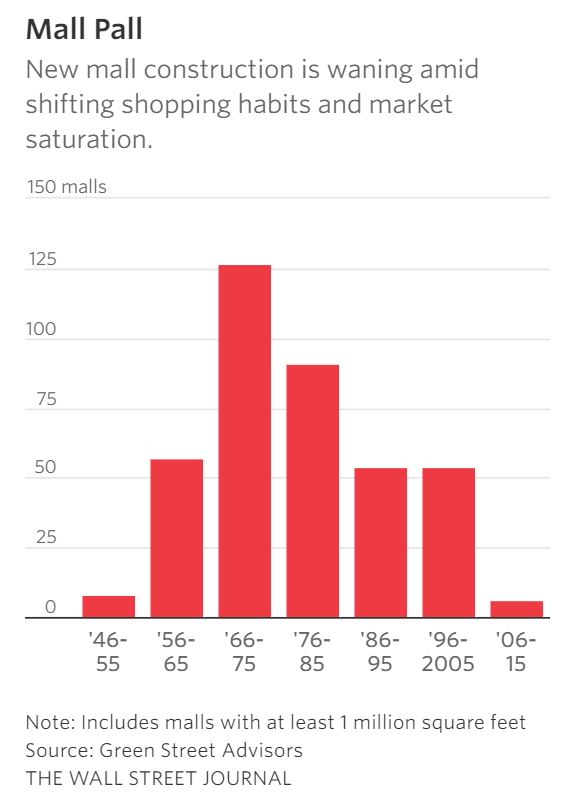
U.S. mall development peaked in the 1970s and has steadily declined. Just six large malls were built between 2006 and 2015, compared with 54 during the previous decade, according to Green Street.
src:
Wall Street Journal, Oct 2017
“Big Mall Operator Does the Unthinkable—Builds a Mall”
paywall, these excerpts via Zerohedge
“With Malls In Full Meltdown Mode, GGP Goes All-In With $525MM Connecticut Mega-Mall”
*
Retail Availability Rates, US, 2016
2005 7.4%
2006 8.1%
2007 9.0%
2008 10.8%
2009 12.6%
2010 12.9%
2011 12.9%
2012 12.5%
2013 11.7%
2014 11.0%
2015 10.7%
2016 10.2%
2017p 10.1%
2018p 10.0%
2019p 10.1%
Excerpts:
The oft-reported demise of the retail sector was another topic tackled by the panelists. But they were not ready to sign on to the prevailing attitude that retail is in steep decline. “Store growth continues on a net basis,” Ludgin said.
The forecast found economists equally optimistic about the retail sector. Vacancy rates (see above) are expected to hold steady at about 10 percent for the next two years, while rental rate growth will decline from 2.7 percent to 2.0 percent in 2018—still above historic averages, the economists predict.
Though the panelists agreed that many elements of the retail sector will continue to struggle—in particular, certain suburban malls—others will see an uptick, especially as the link grows between retail and distribution space. Retail space can play a key role in solving the “last mile” issue.
“The store is just a way to deliver goods to people,” Ludgin said. “You may not need the same square footage, but the store is not dead. . . . It’s performing a somewhat different function than in the past.”
Retail space linked to services and entertainment space is still performing well, Conway said. “What we’re not seeing is addition of shop space,” he said. Suburban malls will have to deal with obsolete space, but many retail spaces will evolve, as we “see the convergence of retail and industrial into one,” he said.
Many online retailers, including Amazon, are starting to invest in brick-and-mortar space, Ludgin noted. And discount department stores “remain extremely viable and are still opening stores,” including chains like T.J. Maxx and Nordstrom Rack, which offer a value proposition. “As a nation, we still like department stores, and we still shop in them. It’s just that they are less in regional malls and more in open-air centers,” Ludgin said.
Centers focused on local interests and artisan wares are also performing well, Reagen added. “There is a huge shift in people wanting something different,” she said. “These are centers that will remain viable.”
SRC:
Urbal Land Institute, citing CBRE, April 2017
“ULI Forecast Calls for Moderate Growth for Most U.S. Real Estate Sectors”
*
2015 Summary from research firm CBRE:
Across major U.S. metropolitan areas, completions of new shopping centre space increased in 2015 and the pipeline of new projects grew. In 2015, 13 significant centres were delivered in the cohort of major metropolitan areas, compared to only six in 2014. Lifestyle centres comprised the majority of deliveries, both in terms of the number of centres and their area; the largest of these was the Village at Westfield Topanga (54,812 sq m) in the San Fernando Valley of Los Angeles. The greatest numbers of new shopping centres were delivered in Texas, with three in Houston and two in Fort Worth. [p.6]…
Within the U.S. there are now 15 major projects under construction up from nine in 2014. The most activity remains concentrated in the New York City metropolitan area, fuelled by the massive American Dream at Meadowlands, which is being developed by the owners of the largest mall in the United States – Mall of the Americas in Minnesota; the centre includes an indoor ski slope, among other attractions. Other projects in the city are smaller, but have a very high profile: The World Trade Center shopping centre in downtown Manhattan, operated by Westfield, and The Shops and Restaurants at the Hudson Yards, a huge new mixed use project developed by Related and Oxford on the West side of Manhattan, and City Point, a mixed use development in downtown Brooklyn (Acadia). Houston has four significant projects under construction, totalling 143,943 sq m. The 15 shopping centres under construction are broadly diversified among new lifestyle centres, super-regional and regional malls and power centres. Generally centres in the U.S. are opening with upwards of 90% occupancy rates. [p.10]
src:
CBRE, Q2 2016
“Global Shopping Centre pipeline rises while overall completion levels start to slow”
*
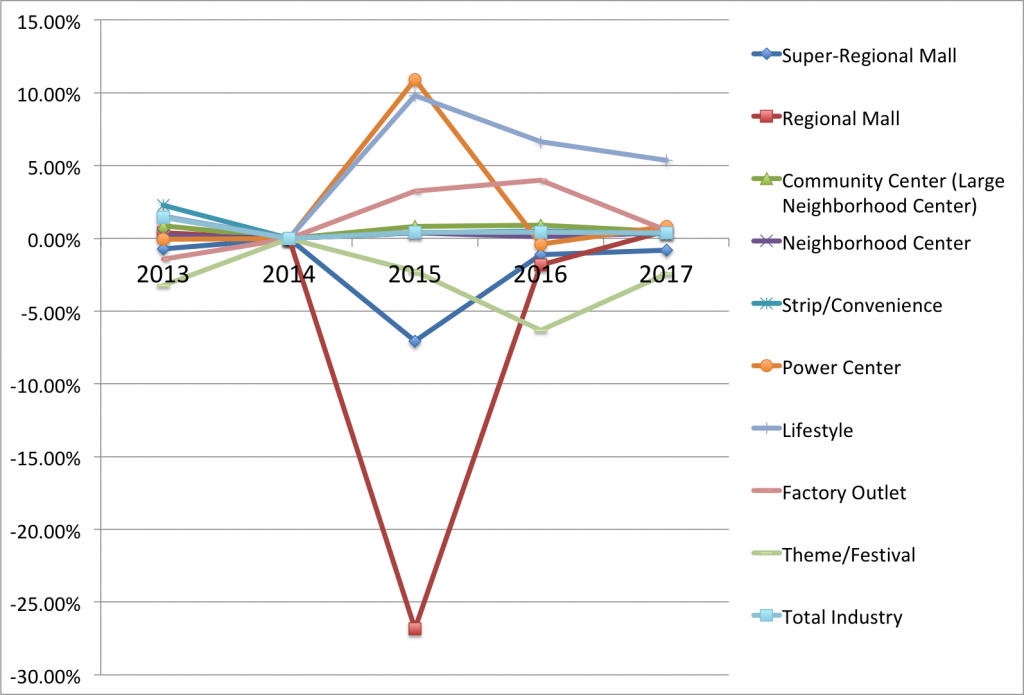
US Shopping Center Rates of Growth, 2013-2017
src:
CC’s calculation of growth based on ICSC data. See OF-charts.xls, “Shopping-Centers” tab.
2017 data:
ICSC, Jan 2017
“U.S. Shopping-Center Classification and Characteristics”
2016 data: 2016 Internet Archive version of above
2015 data: 2015 Internet Archive version
2014 data: 2014 IA version
2013 data: ICSC, 2014 Economic Impact of Shopping Centers
2012 data: ICSC, 2013 Economic Impact of Shopping Centers
Definitions
GLA: gross leasable area
square footage and industry share data below refer to January 2017
Super-Regional Mall
Similar in concept to regional malls, but offering more variety and assortment.
Avg size: 1,255,382 sq ft
% Share of Industry GLA: 10.2%
Regional Mall
General merchandise or fashion-oriented offerings. Typically, enclosed with inward-facing stores connected by a common walkway. Parking surrounds the outside perimeter.
Avg size: 589,659 sq ft
% Share of Industry GLA: 4.7% (Jan 2017)
Community Center (“Large Neighborhood Center”)
General merchandise or convenience- oriented offerings. Wider range of apparel and other soft goods offerings than neighborhood centers. The center is usually configured in a straight line as a strip, or may be laid out in an L or U shape, depending on the site and design.
Avg size: 197,509 sq ft
% Share of Industry GLA: 25.4%
Neighborhood Center
Convenience oriented.
Avg size: 71,827 sq ft
% Share of Industry GLA: 30.8%
Strip/Convenience
Attached row of stores or service outlets managed as a coherent retail entity, with on-site parking usually located in front of the stores. Open canopies may connect the store fronts, but a strip center does not have enclosed walkways linking the stores. A strip center may be configured in a straight line, or have an “L” or “U” shape. A convenience center is among the smallest of the centers, whose tenants provide a narrow mix of goods and personal services to a very limited trade area.
Avg size: 13,218 sq ft
% Share of Industry GLA: 12.0%
Power Center
Category-dominant anchors, including discount department stores, off-price stores, wholesale clubs, with only a few small tenants.
Avg size: 438,626 sq ft
% Share of Industry GLA: 13.0%
Lifestyle
Upscale national-chain specialty stores with dining and entertainment in an outdoor setting.
Avg size: 335,852 sq ft
% Share of Industry GLA: 2.2%
Factory Outlet
Manufacturers’ and retailers’ outlet stores selling brandname goods at a discount.
Avg size: 238,060 sq ft
% Share of Industry GLA: 1.2%
Theme/Festival
Leisure, tourist, retail and service-oriented offerings with entertainment as a unifying theme. Often located in urban areas, they may be adapted from older–sometimes historic–buildings and can be part of a mixed-use project.
Avg size: 147,791 sq ft
% Share of Industry GLA: 0.3%
Airport Retail
Consolidation of retail stores located within a commercial
airport
Avg size: 249,240
% Share of Industry GLA: 0.2%
src:
ICSC (International Council of Shopping Centers), January 2017
“U.S. Shopping-Center Classification and Characteristics”
***
Trends in Chinese Mall Offerings
Wall Street Journal, Jan 2017
“China Has Too Many Shopping Malls”
CC’s summary:
In 2015, 3.7 million square meters of shopping space was under construction in Chongqing — more than anywhere else in the world (and 10x the retail construction in New York). It’s also a much greater shopping stock than what’s found in China’s four first-tier cities (eg: Beijing, Shanghai) — more than 2 square meters per urban consumer, compared with 0.5sq.m in the first-tier cities. This is a problem because new demand has not been as strong as anticipated (as shoppers leapfrog stores and go directly online). The retail vacancy rate has been rising in many Chinese cities. Some department stores are reporting sharp losses, with some closing in the past year. Some retail developers are including entertainment (hotels, aquariums, sports hubs with rock-climbing, ziplines, indoor surfing, ski slopes) as well as shopping in hopes of staying ahead.
*
Financial Times, November 2017
“China’s high street finds growth alongside ecommerce”
Excerpts:
[Chinese] ]Mall operators have responded to the ecommerce onslaught by reducing space devoted to retail and increasing allocations for restaurants, cinemas and outlets offering extracurricular classes for children. Electronics retailers have added in-store experiences and reallocated floorspace for ecommerce distribution.
In 2016, Shanghai’s Joy City mall installed a gigantic Ferris wheel on its top floor to attract customers.
Gome, an electronics store which is Chinas second largest brick-and-mortar retailer by sales, has added experience-enhancing elements in stores, such as virtual reality zones. It’s offline sales grew 10.5% in the first half of the year.
*
KK: HERE IS A BIG RESEARCH REPORT ON WHAT’S NEW IN CHINESE RETAIL. YOU MIGHT LIKE TO SKIM. THINGS THAT CAUGHT MY EYE:
“NEW RETAIL”
buzz phrase in China’s retail sector, refers to retailers with large physical stores reinventing and transforming their business models and formats. Leveraging Internet, VR, AR etc to offer experience- and lifestyle-driven opportunities.
“CEWEBRITY ECONOMY”
Cewebrities are people who become famous on the Internet. Leveraging the power of their fans and social media, many cewebrities, especially fashion cewebrities, have set up online stores to sell fashion items. Some have even launched their own brands.
RURAL E-COMMERCE
The rural online retail market has become a new growth engine with the near saturation of the urban online market. Rural consumers prefer shopping online because of the less developed retail infrastructure in rural areas. … Recognizing the ample growth potential of the rural e-commerce market, increasing numbers of leading retailers and e-commerce players have adopted various “going rural” strategies. For instance, Alibaba has introduced a partnership program in rural areas. Some 20,000 partners were recruited to teach and help rural residents buy online. At the same time, JD.com has made substantial investment in rural areas to expand “last-mile” delivery capabilities; for example, it has tested drone delivery services in some remote rural areas
src:
Fung Business Intelligence, March 2017
“Spotlight on China Retail”
Charts: Monotheism, Retail, Urbanity, Home Size
Ask
Make extrapolated charts for the following:
Monotheism vs. Other & non-affiliated
Ecommerce vs. Physical retail sales
Global urban population
Average house size
Results
Extrapolate: Monotheism vs. other & non-affiliated
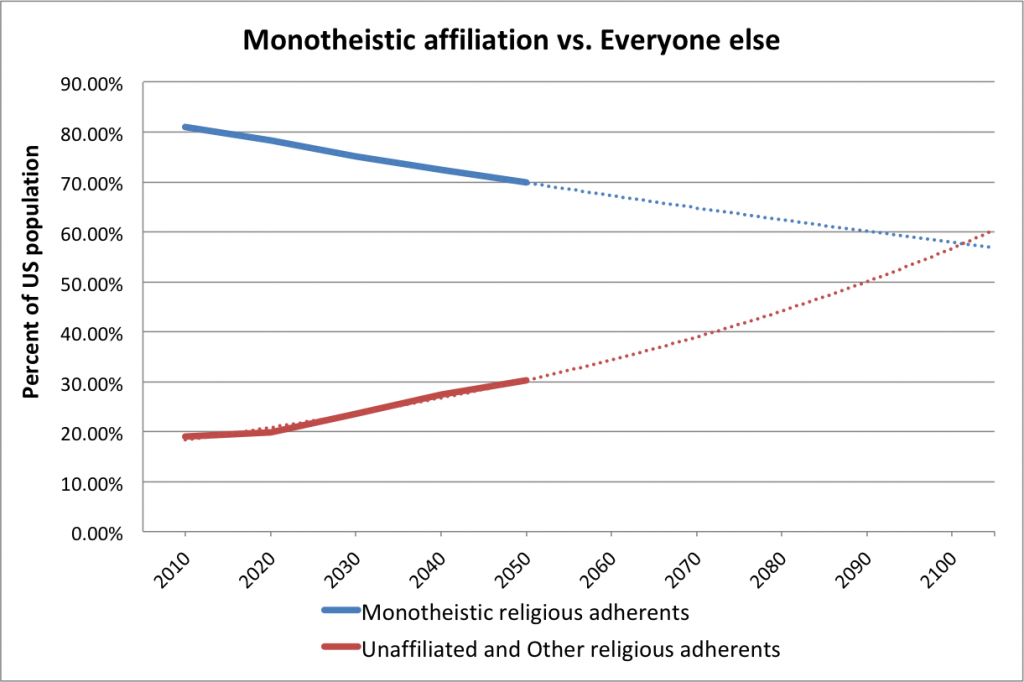
KEVIN: I’M HAVING TROUBLE UNDERSTANDING WHY THESE LINES DON’T CROSS AT 50%. THESE CURVES DON’T SEEM TO BE DIRECTLY CORRELATED.
In this chart, Christians, Muslims, and Jewish adherents are grouped in the Monotheistic adherents category. The red line includes the religiously unaffiliated, Buddhists, Hindus, followers of folk religions, and other religious adherents. Additional methodology on how Pew defined religious groups is available here.
Data for extrapolation (percentage of US population)
2010
Monotheistic religions
Christians 78.3
Jews 1.8
Muslims 0.9
Other
Unaffiliated 16.4
Buddhists 1.2
Folk Relions 0.2
Hindus 0.6
Other Religions 0.6
2020
Monotheistic religions
Christians 75.5
Jews 1.7
Muslims 1.1
Other
Unaffiliated 18.6
Buddhists 1.2
Folk Relions less than 1
Hindus less than 1
Other Religions less than 1
2030
Monotheistic religions
Christians 72.2
Jews 1.6
Muslims 1.4
Other
Unaffiliated 21.2
Buddhists 1.3
Folk Relions less than 1
Hindus less than 1
Other Religions 1.1
2040
Monotheistic religions
Christians 69.1
Jews 1.5
Muslims 1.8
Other
Unaffiliated 23.6
Buddhists 1.4
Folk Relions less than 1
Hindus 1.1
Other Religions 1.3
2050
Monotheistic religions
Christians 66.4%
Jews 1.4
Muslims 2.1
Other
Unaffiliated 25.6
Buddhists 1.4
Folk Relions 0.5
Hindus 1.2
Other Religions 1.5
Sources
Pew Research Center. April 2, 2015.
“The Future of World Religions: Population Growth Projections, 2010-2050.”
US Decadal data
NOTE: Figures for the “less than 1%” values are available for 2010 and 2050 (but not the intervening decades) in the full report
Table: Religious Composition by Country, 2010 and 2050, p.244
*
Extrapolate: Ecommerce Retail
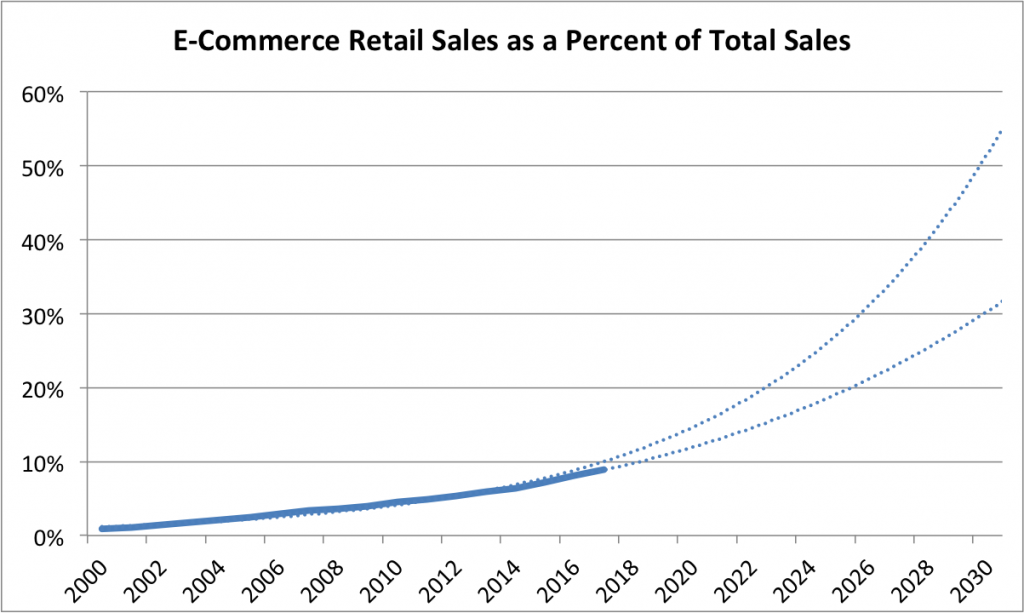
KEVIN – THE STEEPER CURVE IS AN EXPONENTIAL TREND LINE, BUT I FEEL THE POLYNOMIAL TREND LINE LOOKS LIKE A BETTER FIT. AGREE?
Source
U.S. Bureau of the Census, E-Commerce Retail Sales as a Percent of Total Sales [ECOMPCTSA], retrieved from FRED, Federal Reserve Bank of St. Louis; February 28, 2018.
ECOMPCTSA
Frequency: Annual
FRED Graph Observations
Federal Reserve Economic Data
*
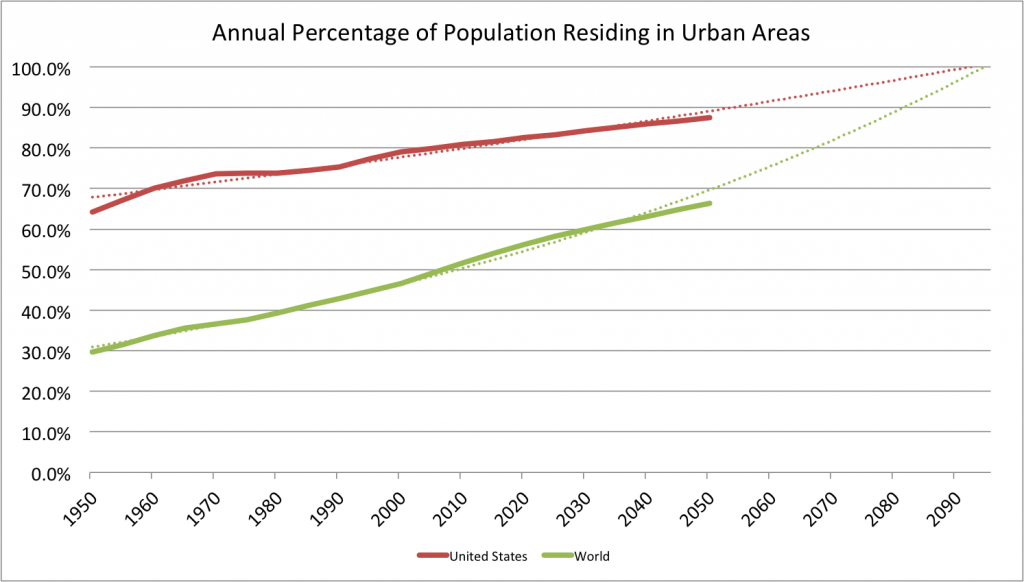
Extrapolate: Urbanization
Source
United Nations, Department of Economic and Social Affairs, Population Division (2014). World Urbanization Prospects: The 2014 Revision, custom data acquired via website.
From the FAQ
How do we define “urban”?
We do not use our own definition of “urban” population but follow the definition that is used in each country. The definitions are generally those used by national statistical offices in carrying out the latest available census. When the definition used in the latest census was not the same as in previous censuses, the data were adjusted whenever possible so as to maintain consistency. In cases where adjustments were made, that information is included in the sources listed online. United Nations estimates and projections are based, to the extent possible, on actual enumerations. In some cases, however, it was necessary to incorporate other estimates of urban population size. When that is done, the sources of data indicate it.
*
Extrapolate: Home Size
Kevin, the following paper on US housing stock and floor space is very good. I’ll excerpt generously from it, but you may like to review the original article, “120 Years of U.S. Residential Housing Stock and Floor Space.”
I DON’T HAVE ACCESS TO THE DATA TO BE ABLE TO EXTRAPOLATE, BUT PERHAPS WE COULD REQUEST IT FROM THE AUTHORS.
Excerpts:
Excerpted Discussion:
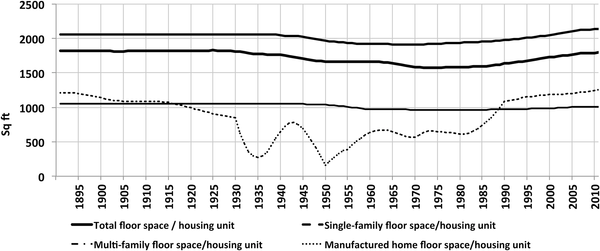
Fig 7 shows the estimated aggregated floor space average over the 120-year period, for each building type, calculated as the ratio of the two estimated time–series, total U.S. floor space and housing stock. Average floor space per unit remained approximately constant throughout the period. A slight ‘dip’ occurred in the 1940–2000 period, but the average returned to pre-1940’s values in the 2000’s, and so floor space per unit averages played a relatively minor role in overall floor space evolution over the very long term.
Excerpted Discussion:
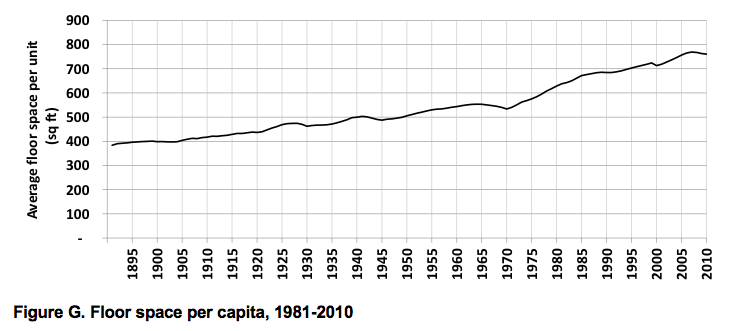
The number of U.S. homes and their associated total floor space have risen dramatically over the last century. From the end of the 19th to the mid-20th century, a net average of half a million homes was added annually to the country’s stock, corresponding to over 850 million square feet added annually. In the last half century, the net average of homes added annually doubled to one million, which led to a tripling of floor space growth, with 2,700 million square feet added annually, with new construction far exceeding retirements. Over the 1891–2010 period, floor space increased almost tenfold, which corresponds to a doubling of floor space per capita (from approximately 400 to 800 square feet (Fig G in S6 File).
Excerpted Conclusion:
Our results show that over the last 120 years floor space and housing stock in the U.S. increased approximately tenfold, while population increased approximately fivefold and household size decreased by a dramatic 50%. Average floor space has remained approximately constant. But can these long-term trends be expected to continue into the future? The interplay between the evolution of population, household size, average floor space growth, as well as other factors, such as the construction rate of single-family homes and the retirement of older smaller vintages, could become significant in future dynamics.
In order to look ahead, it is important to distinguish between short-and long-term trends. The 2008 housing crisis is a recent event from which the housing market is still recovering, so trends in the last decade may not be representative of future developments. Taking the last 30 years into account, however, allows for a better insight into the near future. It is particularly instructive to examine the two factors that have evolved differently over the last three decades, compared to their previous evolution, namely household size and average floor space.
Decreasing household size is a trend with roots in a combination of factors: increased national income, increased mobility, demographic factors such as the aging of the population and the proportion of young adults who are potential homebuyers, and cultural factors such as changing family structures (ex. the increase of the median age at first marriage, family size and the overall decline in the number of married adults, [24]. These factors could contribute to a further long-term decrease of household size, but compared to the decrease in household size since the late 19thC, household size in the U.S. has been decreasing at a slower pace since the 1980’s. In 2007–2010 there was a slight increase from 2.31 to 2.34 persons per household (Fig 6, top), which could either be immediate consequence of the housing crisis, or could indicate a more fundamental change in the long-term trends. A slow economic recovery, with still relatively high unemployment, a rising student debt and the difficulty of obtaining mortgage credits, are all factors that may contribute to a slower decrease or an increase in household size, as young adults are less able to move out of their parents’ homes [25].
In the last 30 years floor space averages have been increasing, as older post-1940 vintages consisting of smaller units, such as those built in the post-war “baby boom” years progressively retire, while larger units are added to the stock. New single family homes built in the first decade of the 21st century averaged 2,673 square feet, while those built in the 1980’s averaged 2,162 square feet (see Table 1). The overall average floor space for units of all building types increased by 13% in the last 30 years, reaching almost 1,800 square feet per unit in 2010 (see Fig 9).
These two factors–household size and floor space averages—have the potential to drive floor space in opposite directions. The observed increase in average floor space is a clear trend, which might only be attenuated if the rate of construction of single-family homes or retirement of older units also slows down. On the other hand, if the tendency for household size to decrease more slowly or increase is indeed a new trend, then both the number of housing units and floor space might accompany population growth more closely than has been the case in the past.
Src:
Maria Cecilia P. Moura, Steven J. Smith, David B. Belzer. August 2015.
“120 Years of U.S. Residential Housing Stock and Floor Space.” PLOS ONE
Note: Figure G (floorspace per capita) is from the supporting document:
S6 File. Results: Floor space time-series.
Shopping
Summary
This collection of data includes the following indicators, dates, and sources:
Retail Space
shopping center growth, 1975-2014, Int’l Council of Shopping Centers
number of private retail establishments, 2001-2015, Bureau of Labor Statistics (BLS)
store count by category, 2010/2015/2020, Kantar Retail
store square footage by category, 2010/2015/2020, Kantar Retail
Consumer Spending
indexed personal spending, 1950-2016, Trading Economics
percent personal spending, 2016/2017/2020, Trading Economics
personal expenditures deflated, 1901-2003, BLS
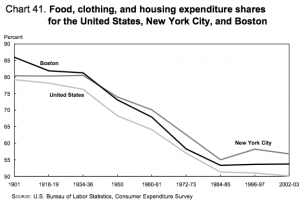
food, clothing, and housing expenditures, 1901-2003, BLS
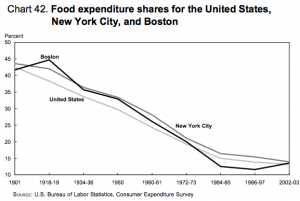
food expenditures, 1901-2003, BLS
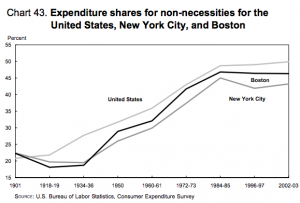
non-necessities expenditures, 1901-2003, BLS
Time Spent Shopping
avg hours per day purchasing consumer goods, 2003-2015, BLS
avg % of people purchasing consumer goods per day, 2003-2015, BLS
avg hours per day for persons so-engaged purchasing consumer goods, 2003-2015, BLS
Online Shopping
retail ecommerce sales as a percent of total US retail sales, 2014-2019, eMarketer
worldwide ecommerce sales growth, 2013-2019, eMarketer
US retail sales as a % of worldwide retail, 2014-2019, eMarketer
US ecommerce sales as a % of total worldwide retail sales, 2014-2019, eMarketer
retail formats % distribution, 2010/2015/2020, Kantar Retail
online share of sales by category, 2009/2014/2020, Kantar Retail
Mall Habits
avg mall visits per month, ~2012, ICSC
avg length of mall visits, ~2012, ICSC
avg monthly spending at malls, 2010/2012, ICSC
Findings
Retail Space
With the U.S. having an estimated 48 square feet of retail space per citizen, the footprint is poised to decline “pretty fast,” Jan Kniffen said.
“On an apples-to-apples basis, we have twice as much per-capita retail space as any other place in the world. The U.K. is second. They’re half of what we are. So, yes, we are the most over-stored place in the world,” he told CNBC’s “Squawk Box.”
In his view, about 400 of America’s 1,100 enclosed malls will fail in the coming years. Of the survivors, about 250 will thrive and the rest will struggle. Likewise, Macy’s probably needs 500 of its roughly 800 existing stores, he said.
src:
Tom DiChristopher. May 12, 2016.
“1 in 3 American malls are doomed: Retail consultant Jan Kniffen.”
CNBC.
Note: This article, though published a year earlier, takes a completely opposite tone of the one above.
Amanda Kolson Hurley. March 2015.
“Shopping Malls Aren’t Actually Dying.”
The Atlantic: CityLab.
*
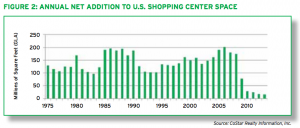
Between 2000 and 2008, U.S. shopping center space – gross leasable area – grew by an annual average rate of 2.6% or a net addition of 169 million square feet (sq. ft.) of retail space per year. However, beginning in 2009, the supply increment slowed dramatically to about one-tenth of that pace. In 2013, the addition of new retail supply grew at its slowest pace in more than 40 years. According to Cushman & Wakefield, over the next three years (2014-2016), the addition of new supply will pick up somewhat as 120.5 million sq. ft. are added to U.S. shopping center inventory. This moderated supply growth is a positive sign going forward (see Figure 2).
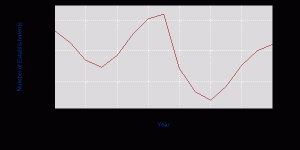
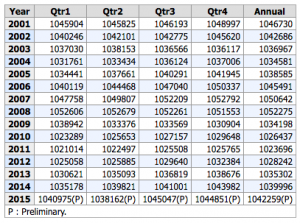
According to the U.S. Bureau of Labor Statistics, the total number of U.S. private retail establishments grew from 1,023,696 in 2011 to 1,028,242 in 2012 – an increase of 4,546 establishments. Preliminary 2013 figures show a further increase of 7,887 retail establishments over 2012 figures to 1,036,129.
src:
International Council of Shopping Centers. 2014.
“Shopping Centers: America’s First and Foremost Marketplace.”
citing:
[CoStar]
and BLS
*
The Bureau of Labor Statistics tracks the number of establishments as part of its Workplace Trends tracking. The following chart and data reflect the number of private retail establishments from 2001 through 2015.
src:
Bureau of Labor Statistics. Accessed August 8, 2016.
“Quarterly Census of Employment and Wages”
Series Id: ENUUS00020544-45
Area: US Total
Industry: NAICS 44-45 Retail trade
Owner: Private
Type: Number of Establishments
linked via “IAG: Retail Trade – NAICS 44-45”
*
Over the next five years, Kantar Retail forecasts that U.S. retail square footage will grow more slowly than the number of stores; in other words, the average store built will be smaller. Conversely, in the previous five years, square footage grew more quickly than stores, resulting in the addition of relatively larger stores (Figure 7).
As Figure 7 indicates, nearly half of new stores over the next five years will be smaller footprint drug, discounter, and convenience stores. As a result, retailers will need to deliver even greater differentiation and specialization from this growth in available points of commerce. Shrunken versions of larger boxes will not suffice. Shoppers will demand that small formats earn their reason for being. Going forward, we expect greater efforts toward differentiation in the small-box space, with in-store marketing (versus simply merchandising) gaining traction.
src:
Kantar Retail. 2015.
“REinvent Format: Adapting to 21st-Century Retailing”
Pp.9, 15
Press contact: Victoria Bradshaw, victoria.bradshaw@kantarretail.com
EMAILED KANTAR RETAIL 8/9/16 TO INQUIRE ABOUT ADDITIONAL DATA POINTS (FOR THIS AND ALL OTHER KANTAR CHARTS MENTIONED IN THIS RESEARCH ROUNDUP).
Consumer Spending
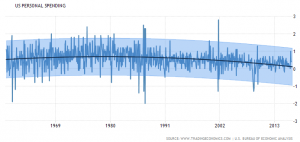
Trading Economics make a short, five-year forecast (currently, to 2020) of various US consumption indicators, based on US Bureau of economic Analysis (BEA) data going back to 1969.
Each indicator has its own page summarizing current data and the forecast to 2020, along with a chart which can be expanded to show data back to ~1950. Each indicator’s page also includes a summary of the forecasts for related indicators. For example, the data on the “United States Personal Spending Forecast 2016-2020” page.
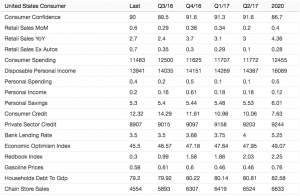
(Note: No units are given in this summary. Generally, the much larger numbers are billions of USD, and the smaller numbers are percentages or index values.)
Trading Economics forecasts are frequently updated (several times per week).
src:
Trading Economics. Accessed August 6, 2016.
“United States Personal Spending: Forecast 2016-2020.”
*
The Bureau of Labor Statistics published a 100-year compilation of national consumer spending data from 1901 through 2003.
Excerpts:
While no two families spend money in exactly the same manner, indicators suggest that families allocate their expenditures with some regularity and predictability. Consumption patterns indicate the priorities that families place on the satisfaction of the following needs: Food, clothing, housing, heating and energy, health, transportation, furniture and appliances, communication, culture and education, and entertainment.
In this report, economic and demographic profiles of U.S. households in the aggregate, as well as profiles of households in New York City and Boston, are presented. New York City and Boston are included because they are two of the country’s oldest urban areas. The report examines how, over a 100-year period, standards of living have changed as the U.S. economy has progressed from one based on domestic agriculture to one geared toward providing global services.
The report provides an in-depth assessment of U.S. households at nine points in time, beginning with 1901 and ending with 2002–03. The text highlights changes in family structure and economic conditions and examines factors that have altered and influenced both society and households. (P.1)
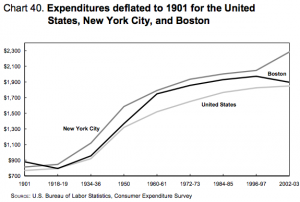
During the 100-year period, household expenditure patterns also demonstrated great variability. … In real dollars, calculated with 1901 as the base, expenditures also demonstrated a notable increase. In 1901, as noted, the average U.S. family had $769 in expenditures. By 2002–03, that family’s expenditures would have risen to $1,848, a 2.4-fold increase. (Chart 40, pp.66-67)
The material well-being of families in the United States improved dramatically, as demonstrated by the change over time in the percentage of expenditures allocated for food, clothing, and housing. In 1901, the average U.S. family devoted 79.8 percent of its spending to these necessities. By 2002–03, allocations on necessities had been reduced substantially, for U.S. families to 50.1 percent of spending. (Chart 41, pp.66, 68)
The continued and significant decline over the century in the share of expenditures allocated for food also reflected improved living standards. In 1901, U.S. households allotted 42.5 percent of their expenditures for food; by 2002–03, food’s share of spending had dropped to just 13.2 percent. (Chart 41, p.68-69)
In 2002–03, the average U.S. family could allocate 49.9 percent ($20,333) of total expenditures for a variety of discretionary consumer goods and services, while the average family in 1901 could allocate only 20.2 percent, or $155, for discretionary spending [eg: family car, reading and education, personal care products, recreation and entertainment, healthcare, alcohol, charitable giving, etc]. (Chart 43, p.70)
src:
US Bureau of Labor Statistics. May 2006.
“100 Years of U.S. Consumer Spending: Data for the Nation, New York City, and Boston.”
Time Spent Shopping
The American Time Use Survey has been conducted annually since 2003. Among many other indicators, it tracks the amount of time Americans age 15 and older spend purchasing goods and services.
src:
Bureau of Labor Statistics. 2003-2015.
American Time Use Survey. ATUS Tables.
“Table A-1. Time spent in detailed primary activities and percent of the civilian population engaging in each activity, averages per day by sex, annual averages.” All years, 2003-2015
NOTE: The “Purchasing goods and services” section of the source table is further itemized. The full itemization is as follows:
Purchasing goods and services
>Consumer goods purchases
>>Grocery shopping
>Professional and personal care services
>>Financial services and banking
>>Medical and care services
>>Personal care services
>Household services
>>Home maintenance, repair, decoration, and construction (not done by self)
>>Vehicle maintenance and repair services (not done by self)
>Government services
>Travel related to purchasing goods and services
The itemization follows from greatest to smallest use of time, EXCEPT for travel, which is the second largest use of time. Grocery shopping generally accounts for about a quarter of the broader consumer goods category, and this is true over the full time period with a slight increase over time (groceries generally hold steady, but the broader category total slowly decreases over time).
Online Shopping
Retail Ecommerce Sales as a Percent of Total Retail Sales in the US, 2014-2019
2014 — 6.4%
2015 — 7.1%
2016 — 7.8%
2017 — 8.4%
2018 — 9.1%
2019 — 9.8%
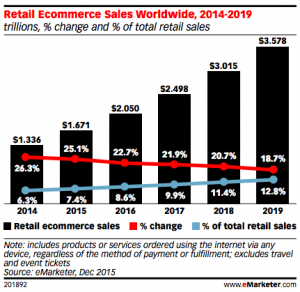
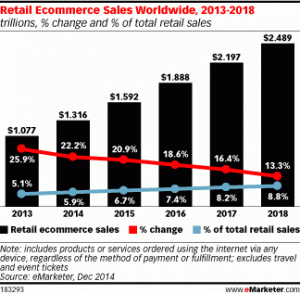
Retail Ecommerce Sales Worldwide, 2014-2019
Showing total ecommerce retail sales, percent change, and percent of total retail sales.
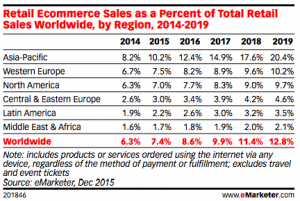
Retail ecommerce sales in North America will rise 14.4% this year to reach $367.44 billion, largely due to increased spending from existing digital shoppers. The region will see consistent double-digit growth through 2019, fueled by expanding online categories, increased average order values and growing mcommerce sales.
Total Retail Sales Share Worldwide, by Region, 2014-2019
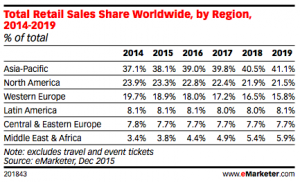
Total Ecommerce Sales as a Percent of Total Retail Worldwide, by Region, 2014-2019
src:
eMarketer. 2015
“Worldwide Retail Ecommerce Sales: Emarketer’s Updated Estimates And Forecast Through 2019.”
*
eMarketer’s previous forecasts
US online retail spending
2015 — 7.1%
2016 — 7.7%
2017 — 8.3%
2018 — 8.9%
src:
eMarketer. December 2014.
“Retail Sales Worldwide Will Top $22 Trillion This Year.”
*
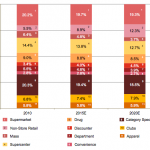
Figure 3: Percent Sales Importance of Retail Formats – 2010 to 2020 [US]
Non-store retail, driven by online today, and likely mobile and tablet commerce in 2020, is projected to be the fastest growing retail channel in the future. Conversely, Supermarket, Drug and especially Mass channel retailers are likely to face a tough growth environment in the coming 2015-2020 period—even if job and income growth surmount global pressures. Likewise, Supercenters, as a percent of total US sales, will decrease to 12.7% from 14.4% today.
src:
PwC/Kantar Retail. 2012.
“Retailing 2020: Winning In A Polarized World.”
P.9
*
src:
Kantar Retail. 2015.
“REinvent Format: Adapting to 21st-Century Retailing”
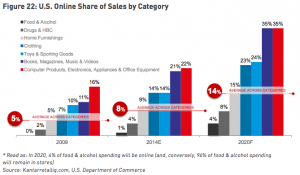
Figure 22: U.S. Online Shares of Sales by Category
P. 21.
Mall Habits
CC’s Note: I’m trying to flesh these single-year data points out. Hoping to get more data from ICSC on the items they’re responsible for below.
*
JCDecaux is an international, outdoor advertising company. They have collected and published the following statistics on mall shopping (most stats seem to be from 2012).
75% of all Americans visit a mall at least once a month. [2]
On average, shoppers visit 3.4 times per month and stay
1 hour and 24 minutes. [1]
Average Time Spent Shopping by Age [1]
Ages 14-17: . . . . . . . . 95 minutes
Ages 18-24: . . . . . . . . 81 minutes
Ages 25-34: . . . . . . . . 79 minutes
Ages 35-44: . . . . . . . . 86 minutes
Ages 45-54: . . . . . . . . 88 minutes
Ages 55-64: . . . . . . . . 87 minutes
Ages 65+: . . . . . . . . . 89 minutes
Average Money Spent Per Visit [4]
Specialty Stores — $109.91
Anchor Stores — $92.80
Monthly Shopping Frequency by Age [4]
Ages 12-17: . . . . . . . . 3.7 times
Ages 18-24: . . . . . . . . 3.2 times
Ages 25-34: . . . . . . . . 3.0 times
Ages 35-44: . . . . . . . . 2.9 times
Ages 45-54: . . . . . . . . 2.9 times
Ages 55-64: . . . . . . . . 3.0 times
Ages 65+: . . . . . . . . . 3.6 times
Shopper spending at malls per month increased from $316.80
in 2010 to $330.82 in 2012. [1]
src:
JCDecaux. Accessed August 8, 2016.
“The Mall Phenomenon.”
citing
1 – ICSC (International Council of Shopping Centers)
PR: Noelle Malone, nmalone@icsc.org
EMAILED 8/8/16 – GOT A REPLY – EXPECTING UPDATED DATA SOON.
2 – Journal of Shopping Center Research
1994-2007 full text archives freely available, but no search
http://jrdelisle.com/JSCR/
Couldn’t track the source
3 – Glimcher Reality Trust
4 – Alexander Babbage, Inc.
Predictions/Scenarios
2030: Half of America’s shopping malls have closed
“For much of the 20th century, shopping malls were an intrinsic part of American culture. At their peak in the mid-1990s, the country was building 140 new shopping malls every year. But from the early 2000s onward, underperforming and vacant malls – known as “greyfield” and “dead mall” estates – became an emerging problem. In 2007, a year before the Great Recession, no new malls were built in America, for the first time in half a century. Only a single new mall, City Creek Center Mall in Salt Lake City, was built between 2007 and 2012. The economic health of surviving malls continued to decline, with high vacancy rates creating an oversupply glut.*
A number of changes had occurred in shopping and driving habits. More and more people were living in cities, with fewer interested in driving and people in general spending less than before. Tech-savvy Millennials (also known as Generation Y), in particular, had embraced new ways of living. The Internet had made it far easier to identify the cheapest products and to order items without having to be physically there in person. In earlier decades, this had mostly affected digital goods such as music, books and videos, which could be obtained in a matter of seconds – but even clothing was eventually possible to download, thanks to the widespread proliferation of 3D printing in the home.* Many of these abandoned malls are now being converted to other uses, such as housing.”
src:
FutureTimeline.net. Accessed August 1, 2016.
“Half of America’s shopping malls have closed.”
*
The Future Real Estate Shopping Experience [undated scenario]
Highlights:
No real estate agents.
VR-based anytime tours that let you see what your stuff would look like in the new place, try different landscaping and remodels.
A machine-learning algorithm monitors your experience to learn your likes and dislikes, recommending other homes to visit.
An AI helps you to write your bid and contact your bank to make an offer on the spot.
src:
Peter Diamandis. March 2015.
“Disrupting Real Estate.”
*
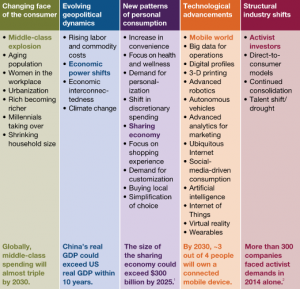
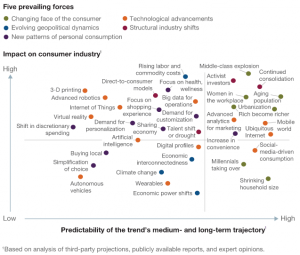
Global forces affecting the consumer sector in 2030
Exhibit 1
Five dominant forces — and an underlying set of trends — will drive change in the consumer landscape over the next 15 years.
Exhibit 2
Trends that could most affect consumer companies.
src:
Richard Benson-Armer, Steve Noble, and Alexander Thiel. December 2015.
“The Consumer Sector In 2030: Trends And Questions To Consider.”
McKinsey & Company.
*
PwC conducts an annual consumer survey, “Total Retail.” The results of the survey published in 2015
PwC. February 2015.
“Physical Store Beats Online as Preferred Purchase Destination for U.S. Shoppers, According to PwC.”
*
Harvard Business Review presented a near-future shopping scenario in the opening of it’s 2011 article on the future of shopping. The article predicted that the scenario would arrive within a handful of years (not quite).
The article closes with some suggestions for how retail stores can use digital technologies innovatively to meet emerging consumer desires.
src:
Darrell K. Rigby. December 2011.
“The Future of Shopping.”
Harvard Business Review.
Other Possible Sources/Contacts
Maureen McAvey
Maureen McAvey is the Bucksbaum Family Chair for Retail at the Urban Land Institute (ULI) in Washington, D.C. She concentrates on urban retail and has led several special projects around demographics and future urban development. She is also a senior staff adviser to ULI’s Building Healthy Places Initiative. [Src]
Email: Maureen.McAvey@uli.org
AT Kearney
Conducts surveys of consumer shopping preferences and behaviors.
EG: “The Omnichancel Consumer Preferences Study”


