Sports and Recreation Participation
Summary
Forecast data for sports and recreation participation seems rare.
The USDA Forest Service has published a few 50-year forecasts of outdoor recreation participation. The forecasts are based on data from it’s semi-regular National Survey on Recreation and the Environment. However, the only national-level forecast I’ve seen was published in 1999. I’ve emailed the authors to inquire if more recent national forecasts have been made. (Forecasts for the southern region of the US have been made as recently as 2013).
The Bureau of Labor Statistics publishes 10-year job outlook and employment change forecasts for professional athletes. The latest figures were published December 2015.
Beyond these two forecasts, I’ve found a couple sources for historic sports participation data: the Sports & Fitness Industry Association’s “Sports Participation in America” and ”Trends in Team Sports Report” (tidbits available through press releases going back to 2007); The Physical Activity Council Report (data for 2010-2015 available, possibly going back to 2000 – emailed for more info); United Health Foundation’s annual “American’s Health Rankings” survey; the National Federation of State High School Associations’ “Athletics Participation Survey” (annual data available 1971-2014).
Data and Excerpts
Non-Professional Adult Participation
The most significant forecast data I’ve found comes from the USDA Forest Service, via a 1999 publication. Later forecasts have been made for specific regions of the US. This is the only set of national-level forecasts I’ve found.
The publication gives projections of future recreation participation (by millions of participants aged 16 and over) and consumption (by millions of days annually and by millions of primary purpose trips taken) at lo-year intervals beginning in 2000 and ending in 2050. Projections for 24 specific outdoor activities and sports are grouped as following: winter, water, wildlife, dispersed land, and developed land. The projections are given as indexes, based on the year 1995.
Two types of regional cross-sectional models were used:
– a logistic regression model (for participation)
– a negative binomial form of a count data model (for consumption)
I’ve aggregated the forecasts in this table.
The data in these projections comes from the National Survey on Recreation and the Environment (NSRE), which has been collected since 1960 (originally as the National Recreation Survey). The survey has been conducted in 1960, 1965, 1970, 1972, 1977, 1982-83, 1994-95, 1999-2001, 2005-2011 (although this report only reflects data through the 94-95 survey).
Src: J.M. Bowker, Donald B.K. English, H. Ken Cordell. 1999. “Projections Of Outdoor Recreation Participation To 2050.” In Outdoor Recreation in American Life.
Note: Emailed the authors, Bowker and Cordell March 14, 2016, to inquire about subsequent national-level projections. No reply received.
*
Sports & Fitness Industry Association (SFIA) reports
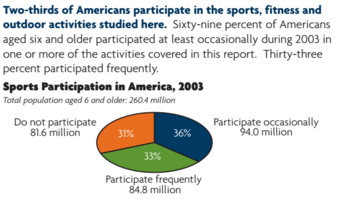
The SFIA (formerly the Sporting Goods Manufacturers Association, or SGMA) has published an annual report called “Sports Participation in America” since 2000 (data going back to 1999). The report describes participation levels in over 100 sports, recreation, and outdoor activities. Each report includes a general breakdown of the number of Americans aged 6 and older who participated in at least one of the covered sports frequently, occassionally (later: regularly or casually), or did not participate in any.
Here’s an example of the chart from the report published in 2004:

Src:
SGMA. 2004. “Sports Participation in America: 2004 Edition.” file name: Sports Part in Am 2004.pdf
I’ve seen data like the above from 1999-2003, and 2008, which is aggregated in this table, in columns C, and E-F. [Sources given in the comments for each cell.] The participation reports also gives a variety of other statistics describing the growth in participation in individual sports, including participation differences correlated with demographic characteristics.
In addition to the participation report, SFIA also publishes data describing core participants in team sports (”Trends in Team Sports Report” — tidbits available through press releases going back to 2007). The distinction of “core” indicates frequent and regular players (the threshold varies by sport/activity). This is the largest collection of core sports participation I’ve found:
Team Sports Core Participation (in thousands)

click for larger
Via: Hotel News Now, May 28, 2013
Note: Emailed Corey Bockhaus, cbockhaus@sfia.org, research@sfia.org, 3/14 to ask about older and more recent data like above. Hoping he can fill the gap in general participation data from 2004-2007, and 2009+.
*
2016 Physical Activity Council Report
Annual study tracking participation in over 120 sports. The PAC report gives overall statistics (percentages and raw figures), as well as sport-specific statistics (raw figures, and annual change percentages).
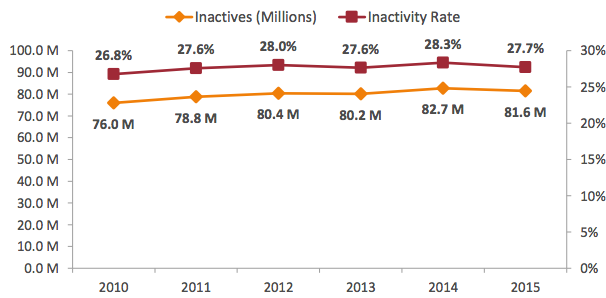
“The overall levels of inactivity decreased marginally in the last 12 months from 28.3% of Americans age six and older in 2014 to 27.7% in 2015. However, there are still 81.6 million inactive Americans.”
“Inactivity decreased for most age groups, with 13 to 17 year olds having the biggest drop (1.4%) and 35 to 44 year olds having the lowest decrease (0.2%) in 2015. While those Americans between the ages of 45 to 54 remained flat in inactivity, there was a gradual increase in inactivity for 55 to 64 year olds.”
212.6 million “actives” taking part in a wide range of sports and fitness activities in 2015, a slight increase from 209.3 actives in 2014.
| Total Participation Rate by Activity Category, 2015 | |
| Fitness Sports | 61.5% |
| Outdoor Sports | 48.4% |
| Individual Sports | 34.8% |
| Team Sports | 23.1% |
| Racquet Sports | 13.5% |
| Water Sports | 14.2% |
| Winter Sports | 7.4% |
| Activity Category Segmented by Generations, 2015 | |||||||
| Individual Sports | Racquet Sports | Team Sports | Outdoor Sports | Winter Sports | Water Sports | Fitness Sports | |
| Gen Z (2000+) | 48.2% | 18.8% | 58.8% | 61.8% | 13.1% | 17.5% | 50.6% |
| Millennials (1980-1999) | 43.6% | 20.2% | 31.8% | 57.4% | 12.2% | 20.3% | 66.7% |
| Gen X (1965-1979) | 36.9% | 13.4% | 17.9% | 51.4% | 7.0% | 14.8% | 66.2% |
| Boomers (1945-1964) | 24.1% | 7.1% | 6.4% | 38.6% | 2.9% | 9.2% | 60.0% |
| Fitness and Activity-Related Spending over a 5-year Span, 2015 (% of people who spent on) |
|
| Sports/recreation footwear | 45.3% |
| Sports/recreation clothing | 44% |
| Outdoor recreation activities | 39.5% |
| Sports/recreation equipment | 34.9% |
| Gym/membership fees | 29.3% |
| Travel to take part in sports & recreation | 28.1% |
| Team sports outside of school | 25% |
| Team sports at school | 20.2% |
| Individual sports events | 19.7% |
| Lessons/instruction/sports camps | 19.3% |
| Winter sports | 17.9% |
Based on 32,658 online interviews with a 95% confidence level. A weighting technique was used to balance the data to reflect the total US population ages six and above. The total population figure used was 294,141,894 people ages six and older.
“Inactivity” is defined to include those participants who reported no physical activity in 2015 and an additional
18 sports/fitness activities that require minimal to no physical exertion.
Contributions from International Health, Racquet and Sportsclub Association, The National Golf Foundation, The Outdoor Foundation, The Snowsports Industries America, The Sports and Fitness Industry Association, The Tennis Industry Association, and United States Tennis Association
The report indicates that data have been collected since 2000, but the report only shows figures going back to 2010.
Note: I’ve emailed to inquire about pre-2010 data (March 9, 2016, info@sportsmarketingsurveysusa.com).
Src: Physical Activity Council. March 1, 2016. “2016 Participation Report.”
*
| Adults reporting no physical activity or exercise outside of work in last 30 days |
|
| 2015 | 22.6% |
| 2014 | 25.3% |
| 2013 | 22.9% |
| 2012 | 26.2% |
| 2011 | 23.9% |
| 2010 | 23.8% |
| 2009 | 24.6% |
| 2008 | 22.6% |
| 2007 | 22.6% |
| 2006 | 23.8% |
| 2005 | 22.5% |
| 2004 | 22.7% |
| 2003 | 24.1% |
| 2002 | 25.4% |
| 2001 | 26.7% |
| 2000 | 27.7% |
| 1999 | 27.7% |
| 1998 | 27.8% |
| 1997 | 27.8% |
Src: United Health Foundation. “United States Physical Inactivity (1997-2015).” Accessed March 16, 2016.
*
Professional Participation
BLS – Athletes and Sports Competitors
2014
Median Pay – $43,350/year
Number of Jobs – 13,700
Job Outlook 2014-2024 – 6% (as fast as average for all occupations)
Employment change 2014-2024 – 800 more jobs
Src:
Bureau of Labor Statistics. Occupational Outlook Handbook. “Athletes and Sports Competitors.” Summary. December 17, 2015.
| Year | Total Employment |
| 1999 | 10,620 |
| 2000 | 9,920 |
| 2001 | 10,520 |
| 2002 | 10,400 |
| 2003 | 11,840 |
| 2004 | 12,250 |
| 2005 | 12,230 |
| 2006 | 12,500 |
| 2007 | 12,670 |
| 2008 | 13,960 |
| 2009 | 13,620 |
| 2010 | 12,660 |
| 2011 | 12,630 |
| 2012 | 12,450 |
| 2013 | 13,880 |
| 2014 | 11,520 |
| 2015 | 11,710 |
Src:
Bureau of Labor Statistics. Occupational Employment Statistics. “OES Data.” 1999-May 2015.
and
Bureau of Labor Statistics. Occupational Employment Statistics. “27-2021: Athletes and Sports Competitors.”
*
Student/Youth Participation
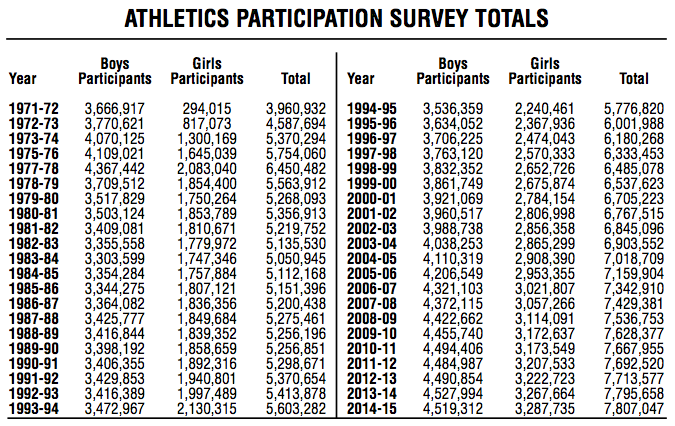
The National Federation Of State High School Associations has conducted its annual “Athletics Participation Survey” since 1971. The survey is completed by high schools with membership in the NFHS and its member associations.

Src: National Federation of State High School Associations. “2014-15 High School Athletics Participation Survey Results.” Page 55 (page 3 of this PDF).
Press release for 2014-15 school year available here.
Excerpt:
“Based on figures from the 51 NFHS member state high school associations, which includes the District of Columbia, the number of participants in high school sports reached an all-time high of 7,807,047 – an increase of 11,389 from the previous year.”
Participation data for recent individual years available are available on the NFHS website at the “Participation Statistics” page.
Note: 3/9 Emailed Bruce Howard to ask what percentage of high school students participate in sports, and what percentage of high schools participate in their survey.
*
Among 6- to 17-year-olds, the average number of team sports played per participant has fallen 5.9 percent in the last five years, dropping from 2.14 to 2.01, according to the SFIA.
| Tracking The Changes In Youth Sports Participation (Participants by ages 6-17, thousands) |
|||
| 2009 | 2014 | % Change | |
| Baseball | 7,012 | 6,711 | -4.3% |
| Basketball | 10,404 | 9,694 | -6.8% |
| Field hockey | 438 | 370 | -15.5% |
| Football (tackle) | 3,962 | 3,254 | -17.9% |
| Football (touch) | 3,005 | 2,032 | -32.4% |
| Gymnastics | 2,510 | 2,809 | 11.9% |
| Ice hockey | 517 | 743 | 43.7% |
| Lacrosse | 624 | 804 | 28.8% |
| Rugby | 150 | 301 | 100.7% |
| Soccer (indoor) | 2,456 | 2,172 | -11.6% |
| Soccer (outdoor) | 8,360 | 7,656 | -8.4% |
| Softball (fast-pitch) | 988 | 1,004 | 1.6% |
| Softball (slow-pitch) | 1,827 | 1,622 | -11.2% |
| Track and field | 2,697 | 2,417 | -10.4% |
| Volleyball (court) | 3,420 | 2,680 | -21.6% |
| Volleyball (sand/beach) | 532 | 652 | 22.6% |
| Wrestling | 1,385 | 805 | -41.9% |
Src: SFIA, via Sports Business Daily, “2014 Trends in Team Sports,” August 10, 2015
Press release for the 2013 Trends in Team Sports available here
[no press releases for more recent reports]
Excerpt:
“Compared to 2011, which saw an increase in only 5 of the 24 sports, the surge in core participation in the most current U.S. Trends in Team Sports Report is proof of the growing trend of specialization in team sports. While there are more quality participants (core), the report also reveals the decrease in overall (casual) team sports participants over the last five years. Since 2008, team sports have lost 16.1 million participants or 11.1% of all team participants, measured by those who played at least once a year.”
2007 Edition excerpts
“While 31.6 million U.S. children (age 6-17) participate in team sports on a ‘frequent’, ‘regular’, or ‘casual’ basis, nearly 19 million U.S. children do not participate in team sports at all.”
…
“900,000 17-year olds played basketball in 2006 which means 17.9% of all 17-year olds played basketball in 2006.”
Src: SFIA. 2007. “U.S. Trends in Team Sports 2007 Edition.”


